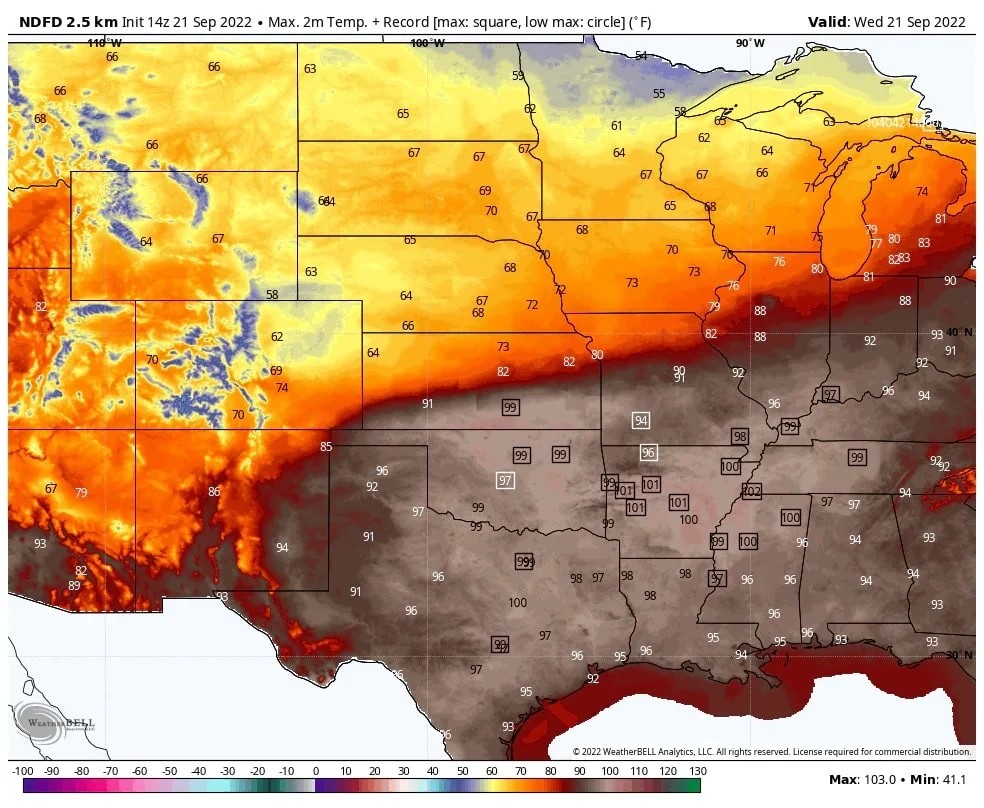
Temperature Variations
GOES - 16 shows where the infrared sensor detects the presence of CO2 in the sky. The legend provided gives the user the ability to see that temperature varies throughout the image, but the actual temperature is not that easy to determine from the legend provided. There are several public accessible ways of determining what the actual temperature variations are. You can check the temperature at your location from local media and compare that temperature with the color scheme on GOES -16 to help train your eye to see what the color variations actually are. You can use the public version of Windy.com, access the temperature tab and then move the cursor over the location of interest, or you can use the public National Digital Forecast Database at: https://www.ncei.noaa.gov/products/weather-climate-models/national-digital-forecast-database to access temperature variations throughout the coverage area. To the right is a copy of an image from the database, as an example. Please note that the color scheme on GOES -16 and the database are not the same.

